Environment Monitoring System Distribution equipment management for
Power Distribution Room 
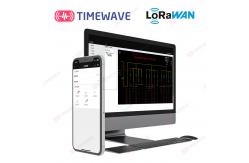
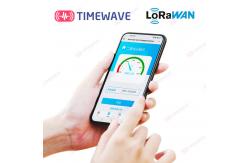
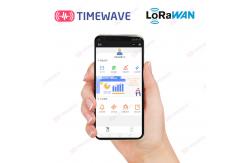
Platform Introduction According to the actual situation of the power distribution room,
we independently developed the TimeWaveCloud distribution room
power environment monitoring platform and intelligent energy
consumption dynamic environment monitoring unit (iFSU). It realizes
load operation monitoring such as current, voltage, power and power
factors, bus temperature measurement monitoring, cable temperature
measurement monitoring, environmental monitoring, entrance guard,
air conditioner/fan control, etc. Realize power environment
monitoring to avoid power distribution equipment operation failure
caused by out of control operation environment. Extend the service
life of equipment and ensure the safety of maintenance personnel. Introduction to system functions and features - Centralized control: iFSU centralized control;
- Communication mode: uplink 4G (CAT1)/WLAN, downlink RS485/wireless;
- Software architecture: B/S architecture+applet/APP+standard API;
- System integration: power monitoring, environmental monitoring,
security monitoring, bus/cable temperature monitoring are
integrated;
- Real time monitoring: monitoring and displaying the voltage,
current, active power, reactive power, power factor and other
operating parameters of the equipment in the power distribution
room. And monitoring the environmental operation parameters of the
power distribution room;
- Real time alarm: alarm for abnormal electrical parameters,
temperature, humidity, equipment failure or communication failure;
- Alarm mode: pop-up alarm, voice alarm, SMS, WeChat alarm, audible
and visual alarm;
- Data query: display and query the real-time operation information
of the power distribution room;
- Display mode: Kanban display, chart and curve graph display;
- Operation report: daily, monthly, annual and operation report;
- Permission management: define the permissions of users at different
levels to ensure reliable and safe operation;
- Layout: cloud platform, local layout.
Wiring diagram - Primary wiring diagram of 10kV box type substation/distribution
room
- Related hardware products
Model |
Major functions | Intelligent energy consumption power environment monitoring unit (IFSU) (Tw-IFSU type) | Data upload interface: RJ45 network interface/RS485/CAT1/NB-IOT/LORAWAN. Switching input: 8 circuits (used for switching value alarm of smog
detector, door magnet, water immersion, 220V mains power failure,
etc.) | DDSD1150/DTSD1150Type three- phase
multi-function electric watt hour meter | It can measure positive active, negative active electric
energy and A/B/C phase electric energy. It can measure total
power, total power factor,A/B/C current,A/B/C voltage,A/B/C
power factor. | Three phase four wire electronic
watt hour meter (DTS150 type) | It integrates the functions of metering, alarm, display, switching,
monitoring power parameters and overload. The combined active
and reactive power can be measured. It has the functions of
measuring voltages, currents,power factors,remote centralized
meter reading,etc. | LoRa Temperature and humidity
sensor | It provides cost-effective LoRaWAN terminal nodes for various work
scenarios. It is an IP64 enclosure. Long operation time and low
maintenance cost.It is very suitable for outdoor use. | LoRa smog detector | The alarm information that can be sent includes:fire, fault,
undervoltage, self inspection, etc. They have universality,
extensibility and readability with the communication protocol
adopted by the upper layer. | LoRa water immersion detector | It is an alarm device for water leakage detection and is
compatible with LoRaWAN protocol.The radio transmission is
based on LoRa long-distance technology. According to the
required behavior and status, the sensor can transmit
information and data to the server. | LoRa Cable temperature
measuring device | A cable temperature measuring devicebased on LoRaWAN. With
temperature detection, data reporting, remote monitoring and other
functions. |
- Functions of system software
- Monitoring data information:Electric energy data: various electric
energy parameters, voltage, current, active power, reactive power,
power factor, etc;
- Out of limit data: voltage, power, temperature, etc;
- Temperature and humidity data: bus contact temperature, cable
temperature, ambient temperature and ambient humidity;
- Smog alarm status and alarm elimination;
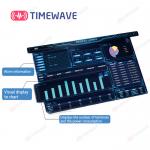
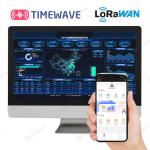
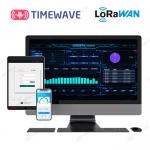
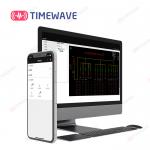
Platform access overview (platform operation and maintenance):
mainly showing the total access, total transformer quantity, total
transformer capacity, total equipment quantity and daily load,
daily electricity quantity and map display. The platform operation
and maintenance display can be shared. - User presentation overview: it displays the power consumption
profile, site profile, operation status, curve and alarm of all
users. Users can be selected from the drop-down box;
- Power parameters: display real-time and historical voltage,
current, power, power factor and other curve information of the
specified site;
- Temperature information: it displays the curve of the ambient
temperature in the substation room, the collection time, the
average value and other information;
- The system provides the pre alarm configuration function, which can
realize the configuration and management of equipment alarm
(equipment offline, analog quantity out of limit, temperature out
of limit, etc.) strategies. You can set the trigger time of the
alarm, the type of the alarm, whether to enable SMS, audible and
visual alarm, etc.
- Pre alert Info: The alert information of the site is recorded here.
Alarm includes: voltage, current and other line crossing alarm;
Switching value alarm; Event alarm; Other alarms. It can record the
total number and category of alarms, and filter alarm information
according to different search conditions. You can also view the
alarm status and send orders to the operation and maintenance
personnel to deal with problems through the dispatch function of
the alarm.
- User management: 4 sub items, including user permission setting,
operation record, control record and system record. User
permissions can be set and changed under high-level user
authorization. Operation records are records of system operations,
such as page switching, system data query, and equipment
operations. The control record is used to record the control
information issued by the system, including time, user and controls
operated. It serves as an important basis for subsequent control
system analysis. The system records the relevant status of the
system operation.
|