
Sine Image Macro Camera Test Chart Resolution / Distortion Analysis Of Macro Lenses
|
Sine Image MACRO TEST CHART analysis of resolution and distortion of macro lenses
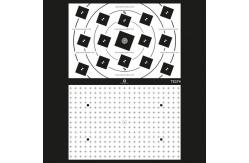
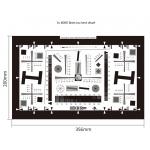
The TE274 Macro Test Chart is designed for the analysis of resolution and distortion of macro lenses attached to SLR and system cameras and compact cameras in macro mode.
The TE274 consists of two parts: • Slanted edges for resolution measurement The chart contains 15 slanted edge structures, each with two vertical and two horizontal edges and a focussing aid in the center. The slanted edge structure is tilted by 5° and has a modulation of approximately 97%.The slanted edges are arranged in a way, to deliver on axis resolution and resolution at 30%, 45%, 60% and 75% of the image height (3:2 aspect ratio). • Cross chart for distortion measurement The black crosses on the white background are used to determine the lens geometric distortion (LGD) and the chromatic aberration. For the software based analysis of slanted edge and distortion images, captured of the TE274, you can use the Image Engineering iQ-Analyzer.
Usage of the TE274 with its framing: Place the chart in its framing on a table below the camera. For starting with the upper part of the chart (slanted edges) slide the chart in the framing to the down- position. Adjust the distance between camera and chart until the slanted edge chart fills the image height.
After taking the images slide the chart in the framing to the upper-position. Now the distortion part is exactly at the position for taking images. No readjustment or refocussing is necessary.
About Us: Contact Information:
Contact Person: Clara Liu; Email: L001@3nh.com; Wechat & Whatsapp ID: +8613510310267; Skype: clara.3nh
|
| Product Tags: camera resolution chart camera lens test chart |
|
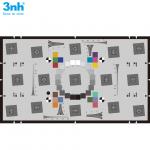
ISO Standard Camera Resolution Chart 3nh / Sineimage For HDTV Cinema Camera Test |
|
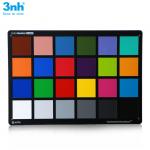
24 Color Checker Resolution Test Chart High Resolution Photographic Paper For Reflectance |
|
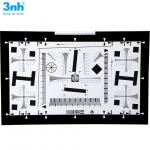
Iso 12233 Resolution Test Chart 2000 Lines Reflectance Test Card 3nh Brand NQ-10-400A 4X |
|
VC-118-Y Camera Test Light Cabinet With D65 TL84 CWF TL83 D50 A Six Light Sources |
|
4000 Lines 1X Resolution Test Chart 20x35.6 Cm ISO12233 Camera Chart NE-10-100A 3nh |
|
3nh High Illumination Transmission LED Light Box With 4 Color Temperature |