
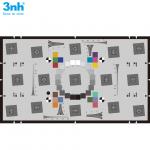
Sineimage YE0268 Lens Resolution Sharpness Test Chart 25 Sinusoidal Modulated
|
Detailed Product Description
|
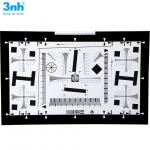
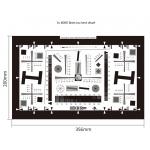
Sineimage YE0268 Lens Resolution Sharpness Test Chart
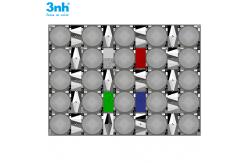
The YE0268 is designed for resolution and sharpness measurements. 25 sinusoidal modulated Siemens stars, 16 slanted edges at four different contrasts, four colored dead leaves structures and rope structure images are placed on the chart. A very detailed analysis over nine different image heights is possible with this chart. The chart has an aspect ratio of 4:3 or 3:2. It is suitable for systems from 2 MP up to 180 MP. Five different structures in the chart allow a numerical and visual
analysis: • 25 sinusoidal Siemens stars are placed at the chart. The stars
have a gray value which changes sinusoidal when walking on a circle
around the center of the star. • Each star is surrounded by 16 gray patches to do an OECF
measurement. This information can be used to linearize the image
data. • 16 slanted edges with a contrast of 100, 80, 60 and 40 percent
are placed between the stars. • Four dead leaf patterns (gray, red green, blue) with reference
patches are placed close to the center of the image. • Images of ropes in the four corners and near the center The chart structures follow the recommendation of ISO standard
ISO12233. According to ISO12233 the sixteen slanted edges can be used to
determine the modulation and the limiting frequency. The analysis
of the sharpening can also be done with these structures. Dead leaves patches complete the resolution measurement. They are
circular structures with random diameters and gray levels.The
structures are constructed to do resolution measurements for
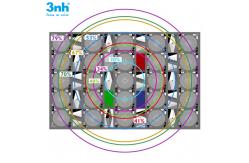
different colors. At the YE0268 test chart the number of Siemens stars is increased
from nine to twenty-five to get a more detailed information about
the image area.The resolution could be determined at these image
heights (in %): 0.00 – 0.20 – 0.34 – 0.41 – 0.53 – 0.67 – 0.70–
0.79. So there is a definitely improved amount of information about
the contrast behavior of the system at different image heights. The YE0268 is designed for resolution and sharpness measurements.
25 sinusoidal modulated Siemens stars, 16 slanted edges at four
different contrasts, four colored dead leaves structures and rope
structure images are placed on the chart. A very detailed analysis
over nine different image heights is possible with this chart. The
chart has an aspect ratio of 4:3 or 3:2. It is suitable for systems
from 2 MP up to 180 MP. Five different structures in the chart allow a numerical and visual
analysis: • 25 sinusoidal Siemens stars are placed at the chart. The stars
have a gray value which changes sinusoidal when walking on a circle
around the center of the star. • Each star is surrounded by 16 gray patches to do an OECF
measurement. This information can be used to linearize the image
data. • 16 slanted edges with a contrast of 100, 80, 60 and 40 percent
are placed between the stars. • Four dead leaf patterns (gray, red green, blue) with reference
patches are placed close to the center of the image. • Images of ropes in the four corners and near the center The chart structures follow the recommendation of ISO standard
ISO12233. According to ISO12233 the sixteen slanted edges can be used to
determine the modulation and the limiting frequency. The analysis
of the sharpening can also be done with these structures. Dead leaves patches complete the resolution measurement. They are
circular structures with random diameters and gray levels.The
structures are constructed to do resolution measurements for
different colors. At the YE0268 test chart the number of Siemens stars is increased
from nine to twenty-five to get a more detailed information about
the image area.The resolution could be determined at these image
heights (in %): 0.00 – 0.20 – 0.34 – 0.41 – 0.53 – 0.67 – 0.70–
0.79. So there is a definitely improved amount of information about
the contrast behavior of the system at different image heights. The maximum resolution of the TE268 A depends on chart size and
diameter of the center mark:
The chart is available in 4:3 and 3:2.
|
||||||||||||||||||||||||||||||||||||||||||||||||||||||||||||||
| Product Tags: camera lens test chart camera test chart |
Related Products
|
ISO Standard Camera Resolution Chart 3nh / Sineimage For HDTV Cinema Camera Test |
|
24 Color Checker Resolution Test Chart High Resolution Photographic Paper For Reflectance |
|
Iso 12233 Resolution Test Chart 2000 Lines Reflectance Test Card 3nh Brand NQ-10-400A 4X |
|
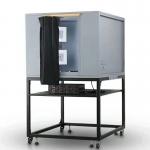
VC-118-Y Camera Test Light Cabinet With D65 TL84 CWF TL83 D50 A Six Light Sources |
|
4000 Lines 1X Resolution Test Chart 20x35.6 Cm ISO12233 Camera Chart NE-10-100A 3nh |
|
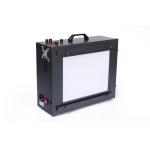
3nh High Illumination Transmission LED Light Box With 4 Color Temperature |
Email to this supplier