
4K UHD TV Universal Test Chart , 16/9 Camera Resolution Chart Sineimage YE0279
|
Detailed Product Description
|
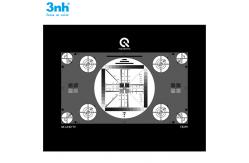
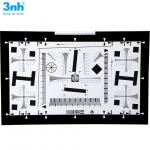
Sineimage YE0279 4K (UHD TV) UNIVERSAL TEST CHART 16:9
This YE0279 test chart is designed for quick (mainly visual)
appraisal of transmission characteristics of 4K (UHD TV) cameras. In the center of the test chart on a gray background (D=0.75; transmission = 18%) a white circle
with gray scales and resolution wedges is located. On both sides of
this central circle four circles with resolution wedges are
arranged. The 16:9 format is marked by four arrows located on the horizontal
and vertical central lines. In addition, four arrows located close
to the circles on the upper and the bottom edge of the picture mark
the 4:3 format. The white central circles shows four gray scales each of 11 steps.
They increase in equal linear steps from D=0.15 to D=1.65 and are
used for checking halftone rendition of cameras. Due to the white
surrounding area the results may, however, be qualified. All frequency values in the camera test chart are indicated in cph
(cycles per picture height). In the central circle three resolution
wedges with different frequencies are arranged vertically and
horizontally. They reach from 200 to 500, from 400 to 1000 and from
800 to 2000 cph. In addition, two resolution wedges angled in 45°
generate frequencies of 400 to 1000 cph. In the middle of the camera test chart and on the left and right
sides there are four squares with line rasters that are inclined at
angles of 0, 45, 90 and 135°. They gene rate a frequency of 400
cph. Those line rasters which are inclined at angles of 45° and
135° generate a diffe rent frequency in horizontal and vertical
direction (due to their inclination). The eight outer circles are arranged in such a way that they can be
used both for 16:9 and 4:3 format. The larger ones show
cross-shaped resolution wedges. The circular rings, which can also
be used for checking geometry, are designed for marking the
resolution in vertical and horizontal direction. Resolution is
shown at 400, 600, 800, 1200 and 1600 cph. The four circles in the
corners have longer resolution wedges. They cross at 640 cph and
have markings from 400 to 1600 cph. In the center of the test chart both in the gray and white area bar elements are arranged with a
length of 1 (=half the picture-height), 2, 4, 8, 16, 32 and 64 cph.
Left to right vertical gray scale there are five additional short
bars with 100 to 900 and 200 to 1800 cph. |
||||||||||
| Product Tags: camera lens test chart camera test chart |
Related Products
|
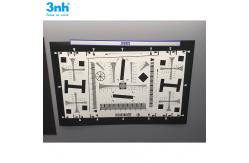
ISO Standard Camera Resolution Chart 3nh / Sineimage For HDTV Cinema Camera Test |
|
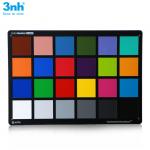
24 Color Checker Resolution Test Chart High Resolution Photographic Paper For Reflectance |
|
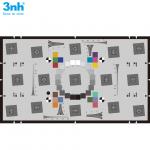
Iso 12233 Resolution Test Chart 2000 Lines Reflectance Test Card 3nh Brand NQ-10-400A 4X |
|
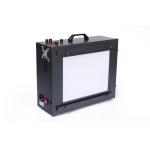
VC-118-Y Camera Test Light Cabinet With D65 TL84 CWF TL83 D50 A Six Light Sources |
|
4000 Lines 1X Resolution Test Chart 20x35.6 Cm ISO12233 Camera Chart NE-10-100A 3nh |
|
3nh High Illumination Transmission LED Light Box With 4 Color Temperature |
Email to this supplier